Preface
A low-voltage feeder trips for the third time this July, on a street with no history of trouble. The network diagram says nothing is wrong. Nothing changed at the substation. What changed happened behind the meters: a few new EV chargers, a dozen rooftop solar installs, a heat wave. Nobody designed this feeder for the load it now carries, and nobody at the utility saw it coming, because the data that would have shown it was sitting unread in fifteen-minute meter reads.
That story repeats itself, in different shapes, wherever a smart meter is already installed: the appliance nobody metered separately but the aggregate signal reveals anyway, tomorrow’s demand a retailer needs before it happens, the theft pattern hiding in a bill that looks almost normal. A smart meter reports one number, at regular intervals. Almost everything interesting is sitting in what that number implies, and almost no single source treats the problem that way: Non-Intrusive Load Monitoring (NILM) texts stop at the appliance, forecasting texts stop at the meter, and grid-planning work starts from substation data and rarely looks downstream, meter by meter [1].
This book follows that signal all the way through. NILM disaggregation turns one aggregate reading into a per-appliance breakdown. Point and probabilistic forecasting of load and photovoltaic output tell a utility, or a household, what is coming before it happens. And once distributed energy resources start reshaping a low-voltage feeder from the edge in, that same signal underwrites anomaly detection, customer clustering, and the hosting-capacity questions a distribution operator has to answer. Every chapter pairs a narrative page with a companion notebook that computes every figure and table it contains.
Anthony Faustine
Principal ML Engineer · sambaiga.github.io
About the Cover
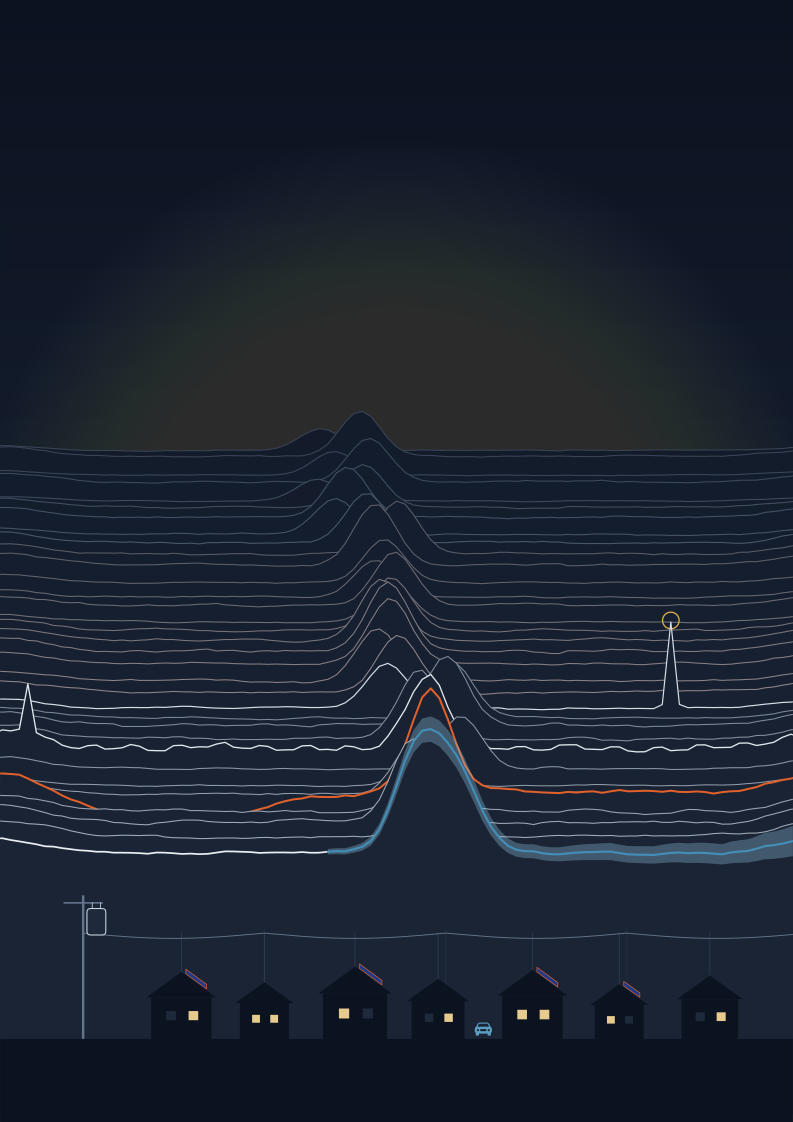
The cover shows a residential street at dusk. Above it rise the daily readings of 34 households, each drawn as one ridgeline from 07:00 to 07:00 the following morning, so that the evening peaks stand at the centre of the page. The readings are computed from the same household model that the illustrations of Part 5 use, and each feature of the picture corresponds to a part of the book.
The grey ridges are the raw meter signal, the subject of the foundations. They are ordered in three groups and faintly tinted blue, orange and green, as clustering groups households into load patterns. Among the front ridges, one carries the regular cycling of a refrigerator and the brief spike of a morning kettle, the appliance signatures that disaggregation separates. Another carries an isolated spike at 03:00, ringed in amber, the kind of reading that anomaly detection flags. The orange ridge falls at midday, when a rooftop Photovoltaic (PV) array supplies the household and exports its surplus. The front ridge is measured until 17:00 and then continues in blue as a forecast with its prediction interval, through the evening peak of an Electric Vehicle (EV) charging session. Beneath them stands the street itself, fed by a pole-mounted transformer: the Low Voltage (LV) network on which the decisions informed by these methods take effect.