


Cluster load profiles#
Group meters by the shape of their day, choose the number of groups from the data, and find the meters that sit between groups.
import matplotlib.pyplot as plt
import numpy as np

from milia import make
from milia.cluster import conformal, selection, validation
from milia.data import profiles, synthetic

BLACK, GREY, OCHRE = "#111318", "#8E887D", "#C47F2C"
hours = np.linspace(0, 24, 48, endpoint=False)

population = synthetic.generate(meters=60, days=90, steps=48, noise=0.35)
shapes = np.asarray(profiles.shape(population.pivot))
shapes.shape
(60, 48)
Look at the data#
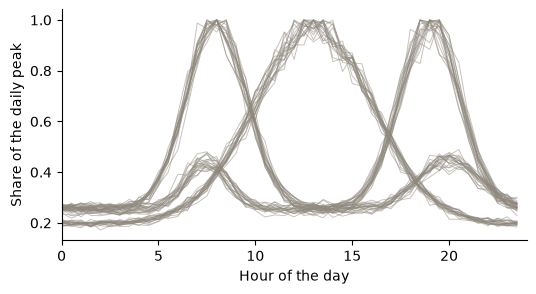
Every meter is one curve: its mean day, divided by its peak.
fig, ax = plt.subplots(figsize=(6, 3))
for curve in shapes:
    ax.plot(hours, curve, color=GREY, lw=0.7, alpha=0.5)
ax.set(xlabel="Hour of the day", ylabel="Share of the daily peak", xlim=(0, 24))
ax.spines[["top", "right"]].set_visible(False)
plt.show()
Choose the number of groups#
scores = validation.sweep(shapes, range(2, 8), resampling=True)
k = selection.recommend(scores, strategy="trust")
scores[["k", "silhouette", "strength", "stability"]].round(2)
| k | silhouette | strength | stability | |
|---|---|---|---|---|
| 0 | 2 | 0.70 | 1.00 | 1.00 |
| 1 | 3 | 0.90 | 1.00 | 1.00 |
| 2 | 4 | 0.68 | 0.58 | 0.77 |
| 3 | 5 | 0.45 | 0.46 | 0.60 |
| 4 | 6 | 0.18 | 0.39 | 0.54 |
| 5 | 7 | 0.14 | 0.31 | 0.52 |
The trust strategy accepts a number of groups only if the groups survive resampling. Here it chooses:
k
3
Fit and read the groups#
labels = make("clusterer", "kmeans", n_clusters=k, random_state=0).fit_predict(shapes)
peak = {c: hours[shapes[labels == c].mean(axis=0).argmax()] for c in range(k)}
order = sorted(peak, key=peak.get)
colours = dict(zip(order, (BLACK, GREY, OCHRE), strict=False))

fig, ax = plt.subplots(figsize=(6, 3))
for c in order:
    for curve in shapes[labels == c]:
        ax.plot(hours, curve, color=colours[c], lw=0.7, alpha=0.3)
    ax.plot(hours, shapes[labels == c].mean(axis=0), color=colours[c], lw=2.4, label=f"Peak at {peak[c]:.0f} h")
ax.set(xlabel="Hour of the day", ylabel="Share of the daily peak", xlim=(0, 24))
ax.legend(frameon=False)
ax.spines[["top", "right"]].set_visible(False)
plt.show()
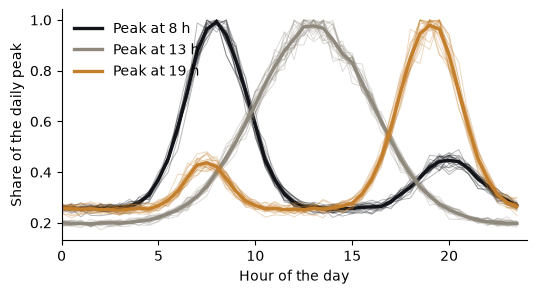
The synthetic population has a known grouping, so the result can be scored:
validation.external(labels, population.labels)
{'ari': 1.0, 'nmi': 1.0, 'purity': 1.0}
Find the meters between groups#
A conformal set gives a meter the groups it plausibly belongs to. A set with one group is a clear member, and a set with two is a meter between them.
sets = conformal.sets(shapes, make("clusterer", "kmeans", n_clusters=k, random_state=0), alpha=0.1)
sizes = [len(sets.predict(row[None, :])[0]) for row in shapes]
{size: sizes.count(size) for size in sorted(set(sizes))}
{0: 3, 1: 57}