Net-Load Forecasting for LV distribution network
Introduction
Over the past few years, renewable energy sources, such as solar photovoltaic (PV), have become increasingly popular due to their low carbon emissions and reduced costs. However, these energy sources also come with a unique challenge: their intermittent nature can make it difficult to maintain grid stability and reliability.
To address this challenge, battery storage systems have emerged as a promising solution. By storing excess renewable energy during periods of low demand and releasing it during periods of high demand, these systems can help maintain grid stability and improve reliability.
But effective battery storage optimization requires accurate forecasting of both demand and generation. Without this information, the battery may not be charged or discharged at the optimal times, leading to increased costs or reduced performance.
Net load forecasting
To design an optimal schedule for a battery storage system in a, half-hourly net load forecasting over several years is required. This schedule should simultaneously reduce peak demands and maximize the use of solar photovoltaic generation.
In power systems, net-load forecasting has emerged as a solution to the challenges of load demand and renewable energy sources (RES) generation forecasting. Net-load refers to the difference between the system load and the RES generation that needs to be met by traditional forms of generation. For instance, in a distribution system with distributed Photovoltaics (PV), the net-load at any given time can be calculated as:
\[P_{NL} = P_{D}-P_{PV}\]In other words, the net-load is the imbalance between the amount of power demanded by the system and the power generated by the distributed PV sources.
Nixtla
Nixtla is a Python-based open-source time series forecasting ecosystem that includes StatsForecast, MLForecast, and NeuralForecast packages for implementing statistical, machine learning, and neural network-based forecasting models. StatsForecast provides a suite of popular univariate statistical and econometric time series forecasting models that are optimized for high performance and scalability. On the hand the MLForecast and NeuralForecast are user-friendly and scalable machine learning and neural network-based forecasting algorithms designed specifically for time series data.
To install these packages:
pip install statsforecast
pip install mlforecast
pip install neuralforecast
Loading and preparing data according to the Nixtla format
Prior to making any predictions using Nixtla, it is highly recommended to load and prepare your data according to the Nixtla format. The Nixtla input requires a data frame in long format consisting of three columns: unique_id, ds, and y. The unique_id column functions as an identifier for the series, and can take the form of a string, integer, or category, depending on the type of data being analyzed.
The ds column is intended to contain datestamps or integers indexing time. For optimal results, a datestamp format such as YYYY-MM-DD for a date or YYYY-MM-DD HH:MM:SS for a timestamp should be utilized. This column provides Nixtla with information pertaining to when each measurement was taken.
Lastly, the y column represents the measurement to be forecasted, and should be a numeric value. Specifically, in the context of forecasting net-load, the y column should represent the actual net-load measurement that is being analyzed.
Presented below is a function that facilitates the conversion of a time series data frame to the Nixtla data format.
def transform_data_nixtla_format(data, target_columns):
    """
    Converts a given time series data frame to the Nixtla data format.

    Parameters:
        data (pd.DataFrame): the time series data frame to be converted.
        target_columns (str): the target column name that will be included in the Nixtla data frame.

    Returns:
        pd.DataFrame: the input data frame converted to Nixtla data format.
    """
    df = data[[target_columns]]
    df.columns = ['y']
    df.insert(0, 'unique_id', 'NetLoad')
    df['ds'] = pd.to_datetime(df.index)
    df = df.sort_values(['unique_id', 'ds']).reset_index(drop=True)
    return df
After obtaining the data frame, the first step is to split it into training and test sets. Once this is done, the data must be converted to the Nixtla format using the transform_data_nixtla_format function.
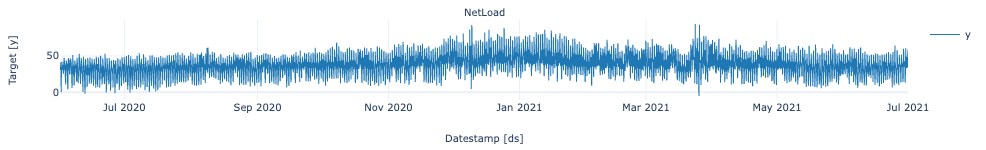
train=slice('2020-06', '2021-06')
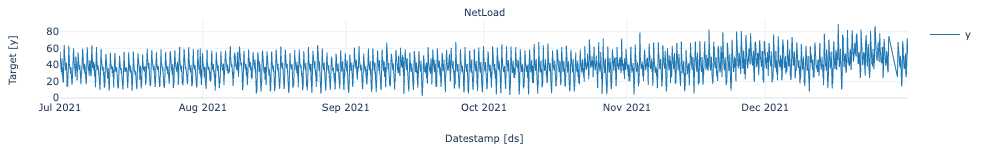
test=slice('2021-7', '2021-12')
train_df=transform_data_nixtla_format(data[train], 'NetLoad')
test_df=transform_data_nixtla_format(data[test], 'NetLoad')
The package includes plot functionality, which enables visualization of data and facilitates exploratory data analysis (EDA).
from statsforecast import StatsForecast as sf
sf.plot(train_df)
sf.plot(test_df)
Baseline model
The Nixtla StatsForecast tool utilizes various classical models to establish a baseline, ranging from Naive to SeasonalWindowAverage. For the specific problem at hand, a Seasonal naive model has been selected as it is particularly effective for highly seasonal data such as netload. Under this model, each forecast is set to be the same as the last observed value from the corresponding season (e.g., the same month of the previous year).
from statsforecast.models import SeasonalNaive
model = sf(models=[SeasonalNaive(season_length=48)], # model used to fit each time series
                    freq='30T')
model.fit(train_df)

y_hat_df = model.predict(h=len(test_df))
sf.plot(y_hat_df,train_df)
The detail nodebook with code implentation for this post is avialble in this github repository.