Beyond Train/test spilit with Streamlit
Introduction
The common practice for applying machine learning to real-world problems is to build a machine learning model using a training set and evaluate its generalisation ability on the test set. While this practice is acceptable for ML researchers, it does not offer adequate room for other users to test and interact with the developed ML algorithm. Allowing end-users to interact with the developed ML algorithms generates interest and makes the end-user part of the ML development and evaluation. Nevertheless, building such an interactive demo has not been straightforward due to the software engineering efforts required to make that happen. Several tools such as Streamlit, Dash, gradio and panel in the Python dashboarding ecosystem have been released to simplify this process. This post will focus on Streamlit.
Streamlit
Streamlit is an open-source Python library that makes it easy to create and share data apps for machine learning and data science. Streamlit is compatible with the majority of python machine learning libraries. Consequently, it makes it easy to create data apps reusing the same python code used for the ML algorithm.
The streamlit API treats the widget as variables, making it easy to build an interactive app without writing HTML, CSS, JavaScript, etc. Deploying and sharing the data apps is also straightforward using Streamlit Cloud. Alternatively, it is also possible to host the data app in your sever.
Create streamlit app
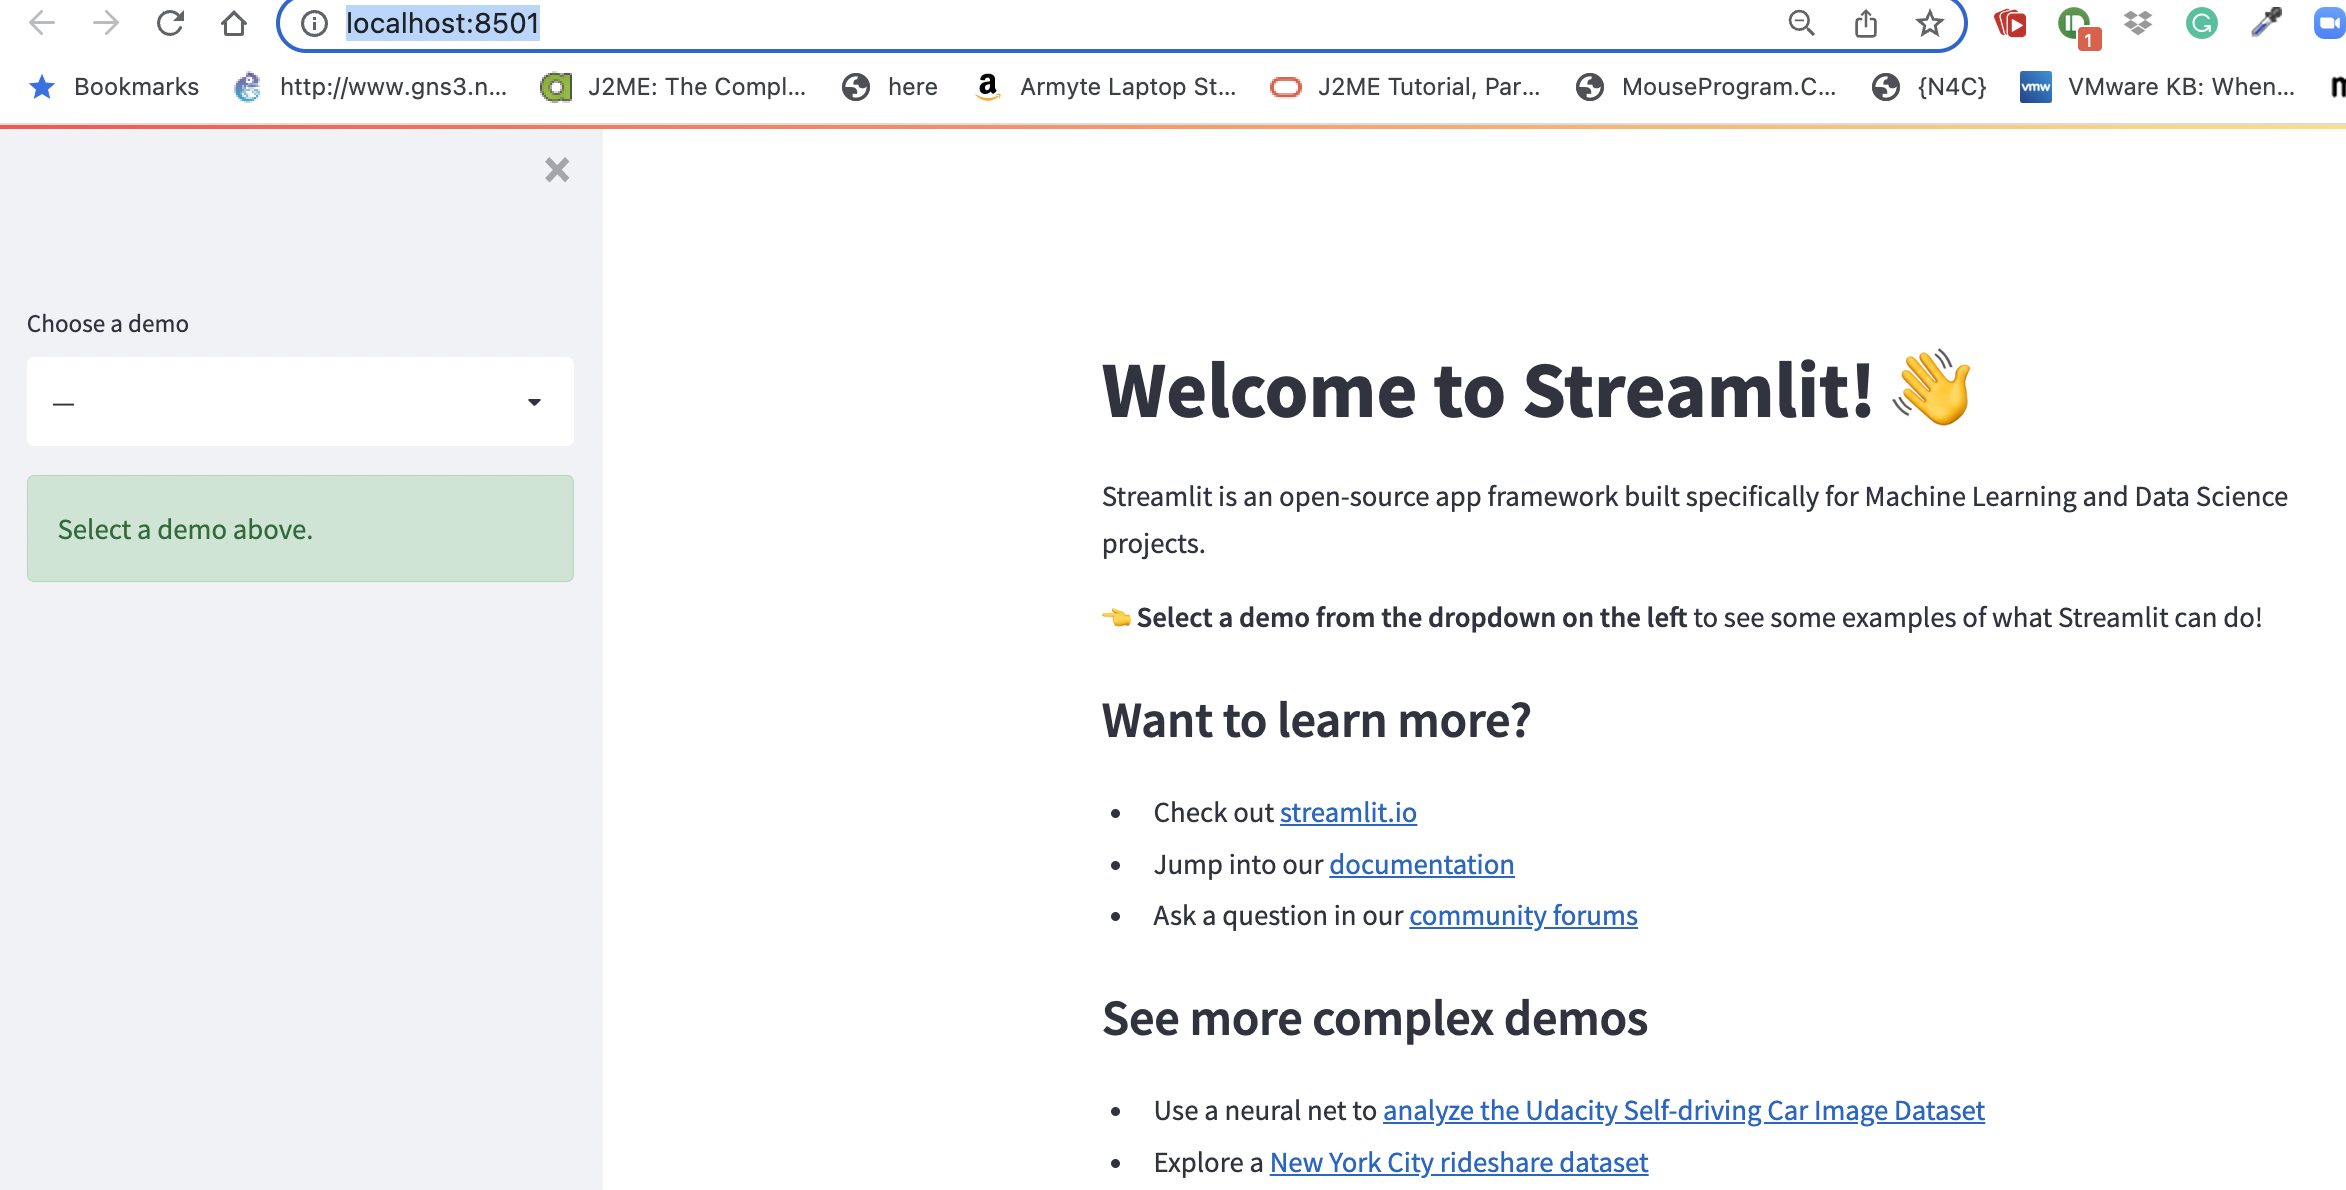
The first step is installing streamlit as follows pip install streamlit. To test if streamlit is installed successfully, run this command on terminal $ streamlit hello.
To create streamlit app, we first need to configure the default settings of the page. This can be done using the following command st.set_page_config(page_title=None, page_icon=None, layout="centered")
For example
st.set_page_config(layout='wide',initial_sidebar_state='collapsed',)
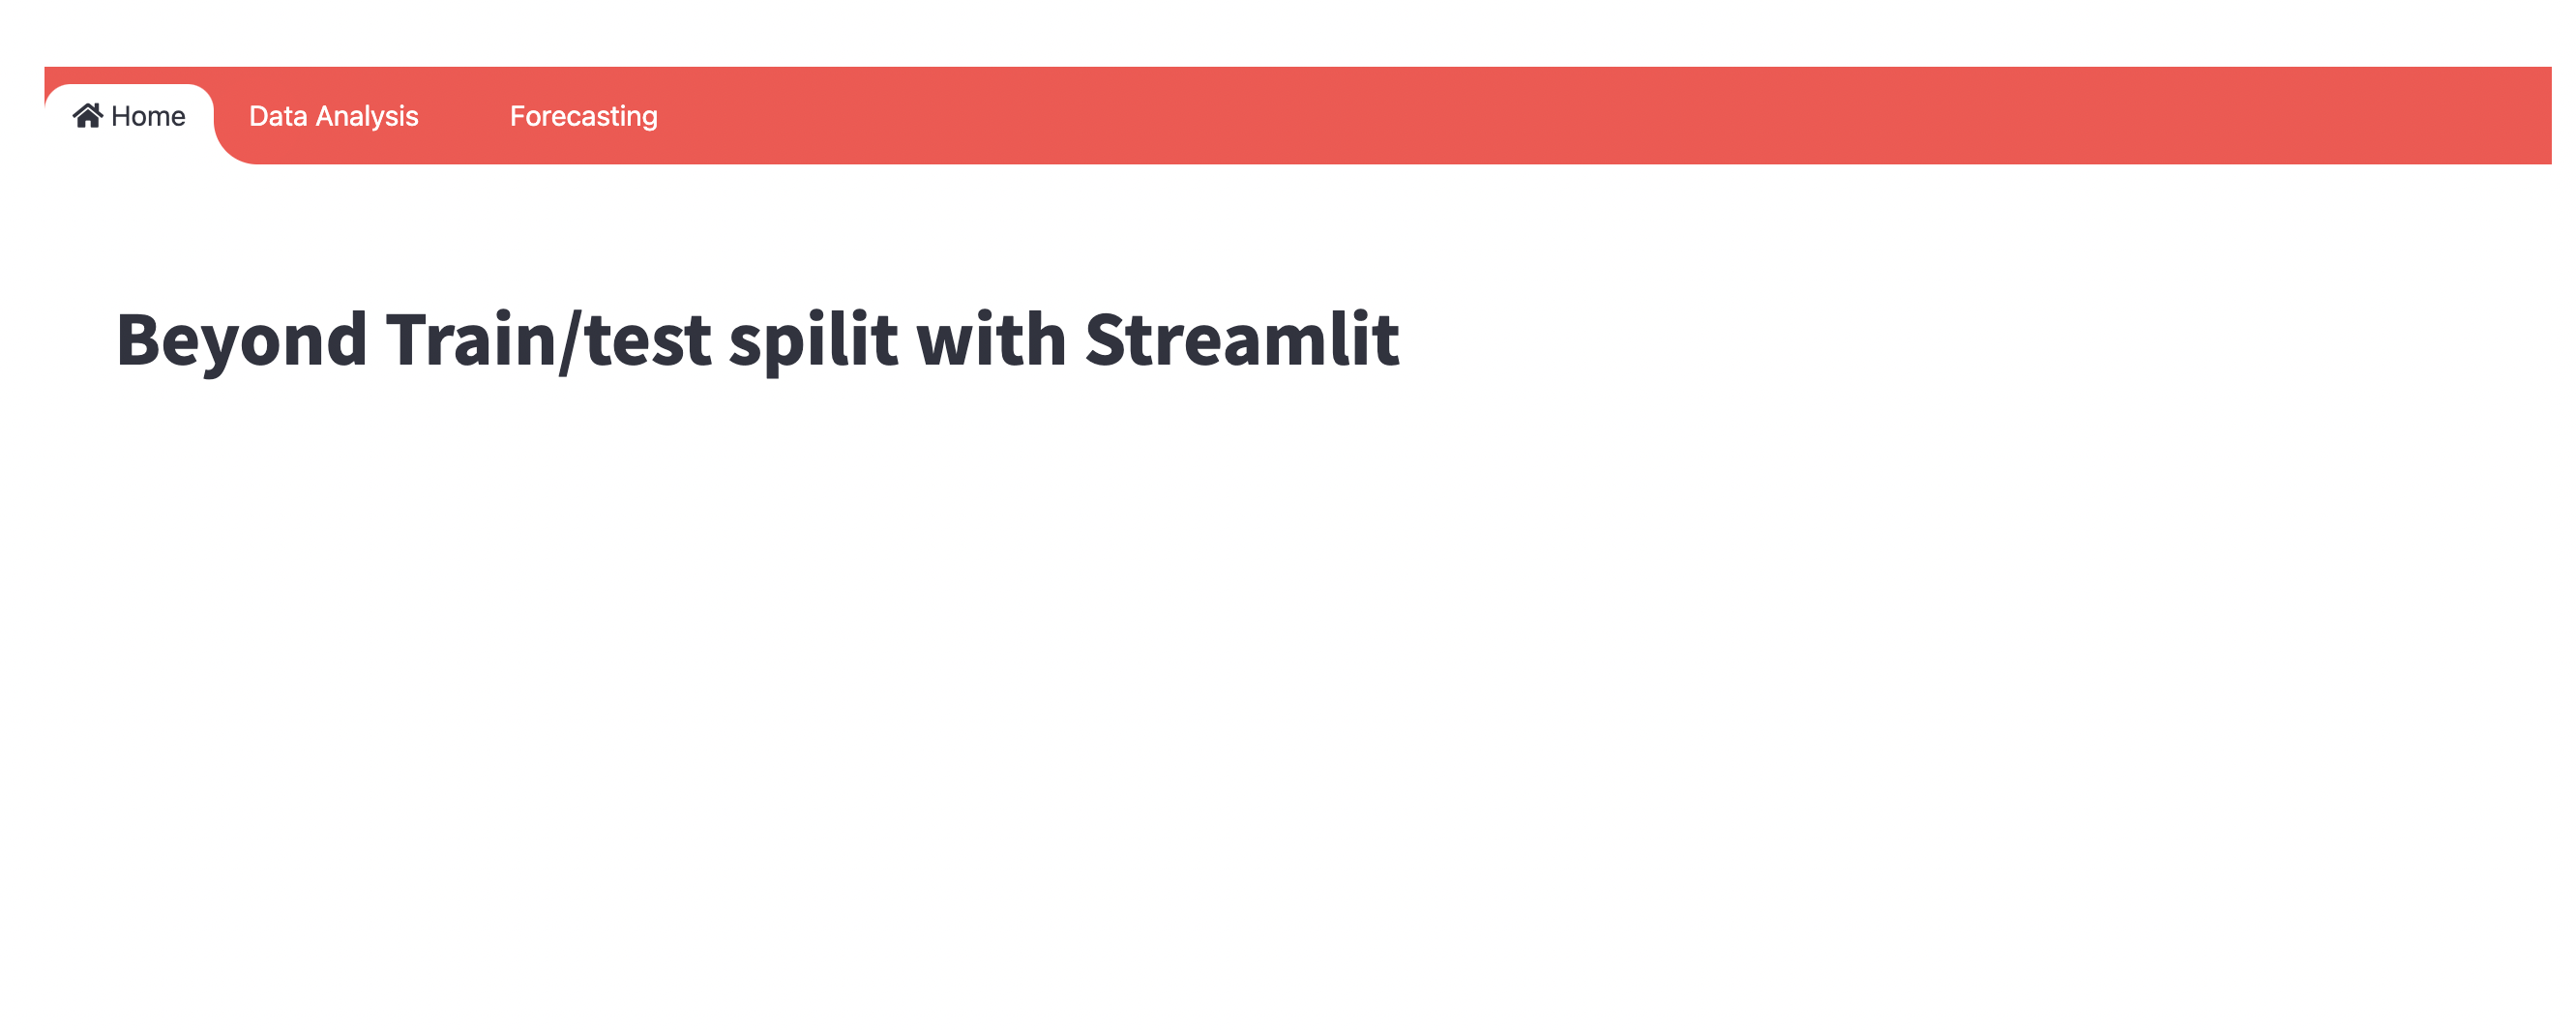
The define navigation bar for the app. There is no standard streamlit widget for this, yet there exists a third party widget that could be used for this purpose. Hydralit Components is a popular package of streamlit components that provide the navbar widget. Install this package pip install -U hydralit_components then define the navigation bar of the app as follows:
menu_data = [
    {'icon':"far fa-line-chart", 'label':"Data Analysis"},
    {'icon':"far fa-info-circle", 'label':"Forecasting"},
]

over_theme = {'txc_inactive': '#FFFFFF'}
menu_id = hc.nav_bar(
    menu_definition=menu_data,
    override_theme=over_theme,
    home_name='Home',
    sticky_nav=True, #at the top or not
    sticky_mode='pinned', #jumpy or not-jumpy, but sticky or pinned
)
After creating the app, launching it is as easy as running streamlit run app.py.
Now we have a streamlit app running. The following post will demonstrate how to visualise a significantly larger dataset and serve up machine learning model on streamlit. The code implentation for this post is avialble in this github repository.